Tech
Programming: New weather sensors graphs
We were previously using matplotlib, a library created to display scientifical values (maths, stats, …) with a wide range of capabilities, not only focusing on graphing temporal values. The downside of this was its complexity, matplotlib is way more complex to implement than RRDTool.
No major impacts for our users except slightly more user-friendly graphs but on our side it opens a new range of future capabilities we might offer to our customers (we could for example develop a module to measure precisely Webcampak network bandwidth performance).
Anyway, from now we’ve got new nice graphs and a more stable software.
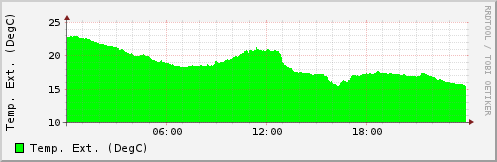 Just take a look at temperature variation compared to humidity. Higher is the humidity lower is the temperature, and vice-versa.
Cet article a été automatique importé de notre ancien blog, merci de nous excuser pour tout problème d’affichage ou image manquante.
TECH